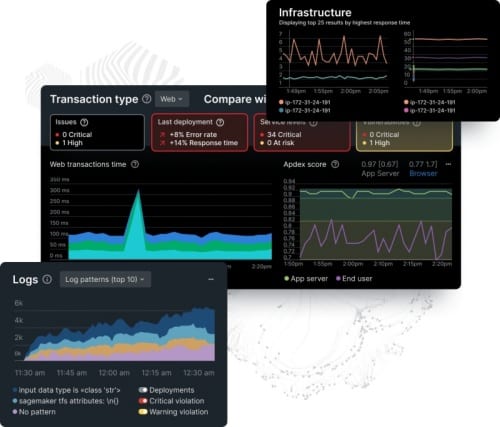
New Relic has unveiled an advanced application performance monitoring (APM) tool that enables developers to go beyond incident troubleshooting insights to daily performance, security, and development insights.
Dubbed as the APM 360, the new APM tool correlates all essential telemetry data across the application stack and development cycle, such as: deployment changes, key transactions, service-level objects (SLOs), logs, infrastructure, errors, security, debugging, and more. It is now available free to all New Relic users across the globe.

"Today, more organisations than ever across the Asia Pacific region recognise the impact of reliable and high-performance applications on their environments. At the same time, the push to accelerate cloud adoption necessitates that IT leaders reassess their monitoring strategy,” said Kris Day, senior vice president, Asia Pacific & Japan, New Relic.
“The evolved APM offering from New Relic will help ensure organisations meet the requirements of cloud-native, hybrid environments, by enabling every engineer to get ahead of potential issues through complete, real-time visibility of all their apps and services."
Kris Day, New Relic
With APM 360, developers, regardless of their role and level of experience, can understand upstream and downstream impacts of issues, discover emerging trends, and ultimately move from traditional monitoring to regular application maintenance and checks with the right insights to prevent potential issues. APM 360 helps all development teams across the organisation gain a shared understanding of system health and close instrumentation gaps, driving platform adoption and increased data flow into the New Relic platform.
Taking APM to the next level
Legacy APM tools suffer from fragmented data, disparate stack views, and undetected monitoring gaps. These data silos, lack of service correlation, and blind spots can inhibit the adoption of application monitoring as a daily practice, which often results in slow incident response, low product innovation, and efficiency loss.
New Relic takes APM to the next level with the new APM 360. It gives engineers a holistic view of applications health and performance with at-a-glance health monitoring and full app lifecycle view in a single place, as well as debugging workflows and automated dependency visualisation to improve customer experiences.

“New Relic APM 360 represents a pivotal moment in application performance monitoring where we have made it easy for engineers to make APM a simple daily practice,” said Manav Khurana, chief product officer, New Relic.
APM 360 provides easy access to the following daily insights:
- Deployment changes: View all deployments and change events without switching tools or screens.
- User experience signals: Track customer impacting transactions and see synthetics checks right in APM.
- Correlated service levels: Monitor SLO budgets and risks directly from inside APM view.
- Full-stack performance: At-a-glance view of services, infras, logs, issues and more to drive daily insights.
- Unified security view: No-instrumentation access to application vulnerabilities from APM agent or third-party sources for a full view of continuous runtime software composition analysis (SCA) alongside APM telemetry.
- Code-level debugging: Drill down to access stack-traces, errors, metrics, and logs in context of code
- Data recommendations: Discover and rectify uninstrumented services, missing alerts, and vulnerabilities.
- GenAI assistance: Coming soon, use New Relic Grok (now in early access) to ask any questions in natural language.
"We pioneered application monitoring over a decade ago, and we have continuously innovated to meet the growing needs of our customers," said Khurana. "We introduced our all-in-one observability platform, offering a way to get all data across logs, infrastructure, and vulnerability management in-context with a single platform pricing. This has laid the foundation for us to redefine the APM landscape once again.”


