As the digital economy in SEA enters a new phase of growth, powered by improved connectivity and thriving online marketplaces such as Lazada and Shopee, businesses are now grappling with a deficit in what is arguably the most critical factor to their success – the attention of consumers.
Contentsquare’s 2023 Digital Experience Benchmark Report reveals a growing ‘consumption crisis’ that threatens digital businesses everywhere, particularly given the precariousness of the current economic climate.
Consumption measures how much content visitors to a site are seeing and engaging with. The study’s consumption metrics reveal average time spent on websites dropped in 2022 by an average of 7.5%. Session depth (the average number of pages viewed in a single session) as well as conversions declined too.

At the same time, traffic rose 4.6% YoY in Q4 of 2022. That means, while brands may be experiencing more people coming through their digital doors, those people aren’t staying long or doing much to make it worthwhile for the business.
What’s fuelling the consumption crisis?
The high traffic/low consumption metric mix shows that visitors are increasingly ‘grazing’ websites. Grazing behaviour is shrinking the average time spent on websites per visit. Therefore, businesses have a proportionally narrowing window of opportunity in which to capture customers’ attention and persuade them to purchase.
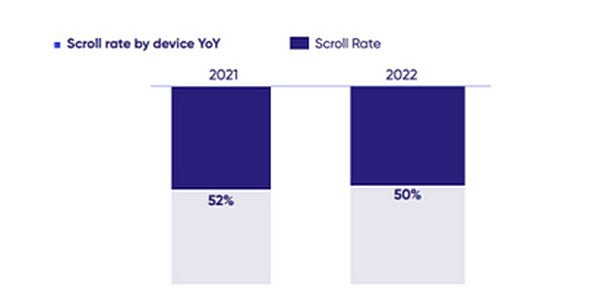
What’s to blame for the growth of grazing? To begin with, our shrinking attention spans. According to Dr Gloria Mark, our average attention span on screens was 2 ½ minutes back in 2004—today, it’s only 47 seconds. The report shows that overall scroll rates have shortened, with more than half of a typical page unseen and untouched by visitors.

There’s more competition for attention and business than ever before, including an estimated 12-24 million websites in eCommerce alone. It doesn’t help that many businesses continue to offer digital customer experiences that haven’t evolved with customer needs and desires, leading to poorer engagement. When businesses make the right adjustments to their digital experience, visitors are better engaged, which leads to lengthier, deeper, more conversion-driving journeys.
Fix frustration to increase consumption
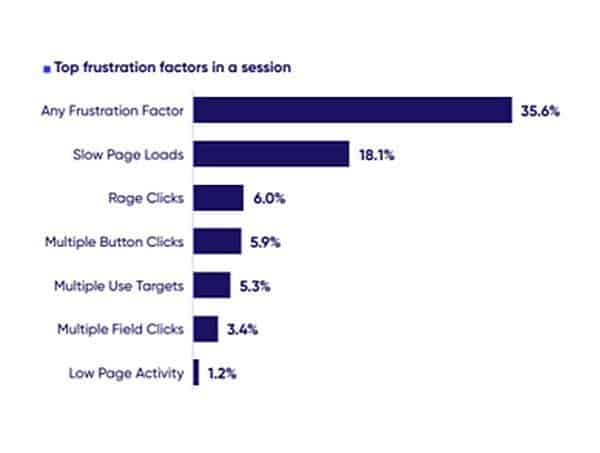
Frustration is an archenemy of consumption. According to the report's data, 1 in 3 user sessions are defined as ‘frustrating.’ What many brands may not realise is that digital journeys are often filled with micro-friction points, and if you have enough of them, you lose the attention, loyalty, and potential revenue of those site visitors.

The all-too-common presence of frustration in customer journeys is contributing to the rise of grazing and the decline of consumption metrics such as average session duration and average time spent on a website. Top frustration factors that create obstacles along the customer journey include slow page loads, multiple button interactions and rage clicks.
More specifically, it’s contributing to the worrying rise of that metric most dreaded by digital teams: bounce rate, which rose in 2022, with 49% of users leaving websites after viewing just one page. By knowing where the frustration lies (and how to quell it) throughout the customer journey, businesses can keep visitor sessions alive and improve engagement.
Fixing slow page loads will minimise frustration and boost conversions. Examples of measures to increase page load speed include caching more to improve site performance, considering using a Content Delivery Network (CDN) to offload most web traffic from servers and downsizing JavaScript (JS) files on pages.
Encourage user activity to drive conversions
Friction pushes visitors away from the website. But to increase average session duration and other consumption metrics, there also must be something drawing them in and down the conversion funnel. A high rate of user activity is the clearest sign that the website is providing value in its customer journeys.
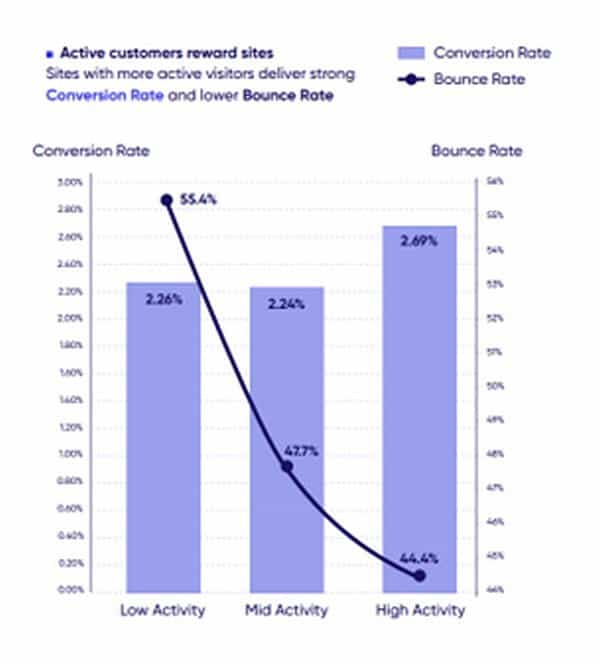
As a metric, activity measures the share of time users spend interacting with the website (with clicks, scrolls, swipes and typing). The report found that sites with higher activity enjoy 19% higher conversion rates and 20% lower bounce rates than sites with the lowest activity.

Activity is an indicator of consumption and positive outcomes: reduced bounces, deeper sessions and boosted conversions. In a digital era characterised by grazing, encouraging activity will help strengthen the experience and drive growth. Measuring activity levels will help businesses better understand how visitors use different page types.
Category pages, for example, generate more activity than product pages as they tend to provide users with more interactive elements while product pages are where customers pause to take in information and make a ‘go or no-go’ decision.
Beyond traditional KPIs - monitor every aspect of your CX
Many digital teams are held back by thinking they have a complete understanding of the customer journey using traditional analytics tools. These tools often tell you how much traffic you’re attracting, losing and converting. But they can’t detect, alert, and prioritise improvements outside of conventional errors.
To close the customer behaviour insights gap, brands now need rich, contextual insights that provide a holistic understanding of their customers’ behaviours, including what’s happening and why, between clicks.
Digital experience analytics (DXA) leverage machine learning to offer actionable insights into precisely what the customer wants from the brand’s site, how they use it and how they feel about the entire end-to-end experience. Understanding why customers behave the way they do will help businesses prioritise decision-making based on empathy and on what will drive the greatest impact.
Only with this holistic analysis can businesses build a digital experience designed for humans and capture their highly coveted attention and support engagement, conversion and growth.


