The future of sales is rooted in data-driven decision-making. Being data-driven doesn’t minimize the need for business acumen. However, it does represent a deliberate shift from basing decisions on intuition alone.
In a 2020 survey, sales operations leaders (n=299) reveal that improving sales data literacy was a key priority. Interestingly, the findings around sales data literacy revealed that frontline sales managers, direct sellers, and overlay sellers were among the lowest-ranked in terms of fluency.
Consider that for a moment. The focus is on sales data – pipeline metrics, seller activity, etc. – yet managers and sellers often struggle with how they consume, process, and communicate data in context.
Undoubtedly, this is a challenge for sales operations leaders. Unfortunately, many sales operations functions aren’t focusing on data literacy. Instead, they are working to:
- Aggregate data sources
- Govern data hygiene and quality
- Produce reports and dashboards
These are all important but for a sales organization to become data-driven, sales operations leaders must deliberately work to assess and improve data literacy. At the same time, it may be time to revisit how we design sales reports and dashboards.
Know what good looks like
I speak with many sales operations professionals who still develop “kitchen sink” reports. These reports intend to be comprehensive, “all in one” displays of data. Sadly, these massive reports put too much burden on users.
Many users simply aren’t able to translate the data into usable information to reveal insights and improve decision-making. Sales operations leaders must take a different approach to overcome the challenges of lower data literacy among key stakeholders including:
1 – Develop reports for specific use cases
It’s a much better practice to target reporting for use cases. This reduces user burden and counters low data literacy. The use case does not need to be overly complex but should indicate how and why users will gain benefit from a given report. Specificity is key!
2 – Index values to complement absolute metrics
Let’s assume that a sales manager observes that a seller has 17 deals in their pipeline. Clearly, 17 is an important metric but it’s an absolute value without reflection on the level of goodness. Alternatively, to improve how the number of deals in the pipeline is interpreted, the value should be indexed. Assuming the target number of deals is 20, the sales manager can more easily coach a seller if the number of deals in the pipeline is displayed as 85%.
3 – Put results in context
Using snapshots of data is common but can mask the potential insights. Going back to the previous example of a seller with 17 deals in the pipeline, it’s hard to know the context without comparison for context.
The comparison could be to others in the role. However, it can also be a longitudinal comparison showing the trended performance over time. Certainly, 17 deals in the pipeline are below expectations, but it’s not terrible if the trendline is improving.
4 – Provide a sentiment indicator
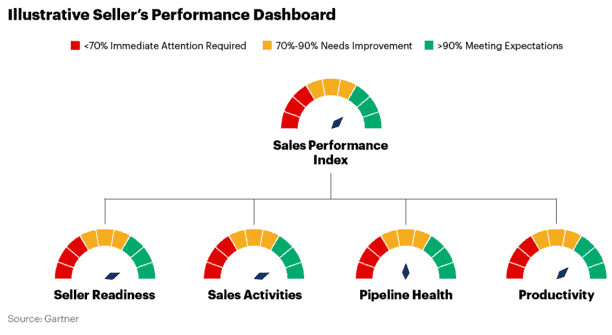
Sellers and sales managers may struggle in consuming data and drawing the correct insights to improve decision-making. This data literacy risk is mitigated with easy-to-consume indicators. The figure below shares sentiment indicators using performance dials and color-coding.

Sales operations leaders embracing data-driven decision-making must help users improve their utilization of sales analytics. While the ultimate goal is to improve data literacy across the organization, simple improvements to report creation are a great first step.
First published on Gartner Blog Network


